
Hello~
This post is about Venn Diagrams from Chapter 3
The history on John Venn:
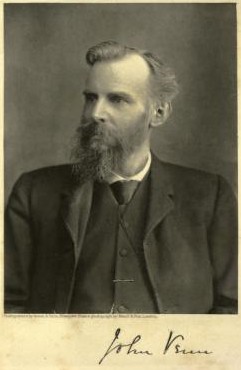
John Venn FRS (4 August 1834 – 4 April 1923), was a British logician and philosopher. He is famous for introducing the Venn diagram, which is used in many fields, including set theory, probability, logic, statistics, and computer scienceVenn also had a rare skill in building machines. He used his skill to build a machine for bowling cricket balls, which was so good that when the Australian Cricket team visited Cambridge in 1909, Venn's machine clean bowled one of its top stars four times.
Venn's main area of interest was logic and he published three texts on the subject. He wrote The Logic of Chance which introduced the frequency interpretation or frequency theory of probability in 1866, Symbolic Logic which introduced the Venn diagrams in 1881, and The Principles of Empirical Logic in 1889.
In 1883, Venn was elected to the Royal Society. In 1897, he wrote a history of his college, called The Biographical History of Gonville and Caius College,1849–1897. He began a compilation of biographical notes of Cambridge University alumni, a work which was continued by his son, John Archibald Venn (1883–1958) and published as Alumni Cantabrigiensesin 10 volumes from 1922-1953.
The Venn Diagram:
A Venn diagram is constructed with a collection of simple closed curves drawn in a plane. According to Lewis (1918), the "principle of these diagrams is that classes [or sets] be represented by regions in such relation to one another that all the possible logical relations of these classes can be indicated in the same diagram. That is, the diagram initially leaves room for any possible relation of the classes, and the actual or given relation, can then be specified by indicating that some particular region is null or is not-null".[1]
Venn diagrams normally comprise overlapping circles. The interior of the circle symbolically represents the elements of the set, while the exterior represents elements that are not members of the set. For instance, in a two-set Venn diagram, one circle may represent the group of all wooden objects, while another circle may represent the set of all tables. The overlapping area or intersection would then represent the set of all wooden tables. Shapes other than circles can be employed as shown below by Venn's own higher set diagrams. Venn diagrams do not generally contain information on the relative or absolute sizes (cardinality) of sets; i.e. they are schematic diagrams.
Venn diagrams are similar to Euler diagrams. However, a Venn diagram for n component sets must contain all 2n hypothetically possible zones that correspond to some combination of inclusion or exclusion in each of the component sets. Euler diagrams contain only the actual possible zones for a particular given context. In Venn diagrams, a shaded zone may represent an empty zone, whereas in an Euler diagram the corresponding zone is missing from the diagram. For example, if one set represents dairy products and another cheeses, the Venn diagram contains a zone for cheeses that are not dairy products. Assuming that in the context cheese means some type of dairy product, the Euler diagram has the cheese zone entirely contained within the dairy-product zone—there is no zone for (non-existent) non-dairy cheese. This means that as the number of contours increases, Euler diagrams are typically less visually complex than the equivalent Venn diagram, particularly if the number of non-empty intersections is small.[2]
-Yay for diagrams, Sufie
Last year Google paid tribute to John Venn for finding venn diagrams .I remember the doodle as well. Respect!
ReplyDeletecreately
it really does help the students a lot :) R E S P E C T !
ReplyDelete#684
This comment has been removed by the author.
ReplyDeletethis is a good invent it helps alot
ReplyDeleteWhen Creating a Venn Diagram,
ReplyDeletePlan the timeline for the information gathering, analyzing, presentation, and sharing. Gather the information you need to capture to create a venn diagram. Make sure to collect the information within the planned time frame.
Create a rough outline of the diagram by arranging the gathered information in chronological order. This step will also help you filter out the key details from the rest of the researched data.